Your website could have the best content in your industry, a beautiful design, and a rock-solid backlink profile. If it loads slowly, none of that matters as much as you think. Visitors leave. Google notices. Rankings slip.
This isn’t a new problem, but it’s one that keeps catching businesses off guard. A site that felt fast two years ago might be sluggish today because expectations have shifted, and so have Google’s standards. Understanding what page speed actually is, why it functions as a ranking factor, and how to fix the issues behind a poor score puts you ahead of most competitors who are still treating this as an afterthought.
GOA-TECH, a Miami-based digital agency, handles technical SEO and website optimization as part of its full-service approach. This guide covers the core concepts, the key metrics, and the specific steps you can take to improve load performance and protect your rankings.
 Why Page Speed Is a Legitimate Ranking Concern
Google officially introduced page speed as a ranking factor for desktop in 2010, with the Speed Update expanding this factor to mobile in 2018. And more recently, Core Web Vitals have also become direct ranking signals that reflect how your pages perform for actual end users.
The reasoning is obvious. Google’s primary goal is to direct users to websites that load fast and don’t waste their time. Slow pages waste time, lead to a poor user experience, and lower conversion rates. Google knows all this and will demote slower results in the rankings.
According to research by Akamai, a one-second delay in page load time can reduce conversions by up to 7%. But slow pages hurt more than just conversion rates: they also affect your crawl budget. When Google’s crawling bot visits a slow-loading site and page, the bot will often skip over it and won’t index it, resulting in the loss of indexed pages you aren’t even aware of.
Understanding the Key Metrics to Focus On
You need to track your performance data to be able to optimize and improve it. These are the key metrics you should be monitoring:
Time to First Byte (TTFB) measures how long it takes the server to send the first byte of information after a user makes a request. This can provide useful feedback about your hosting quality, your server’s processing time, and other processing overhead. Under 800ms is acceptable, but the real target for a good user experience is under 200ms.
First Contentful Paint (FCP) measures how long after a user visits a page it takes until the first piece of content, such as text or an image, appears on the screen.
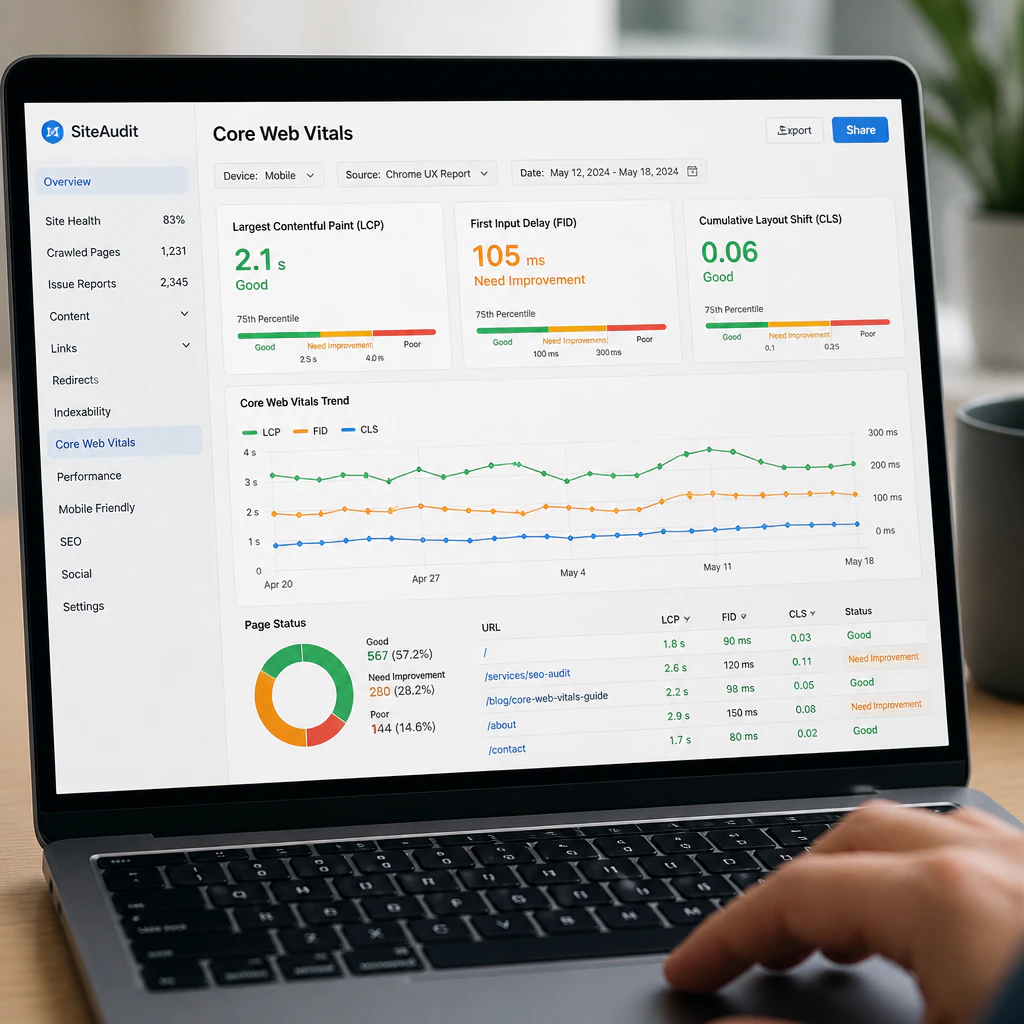
Largest Contentful Paint (LCP) measures how long after a user visits a page it takes until the main content (usually the largest image or block of text) appears on screen. To deliver a good user experience on mobile devices, the LCP of an important URL should occur under 2.5 seconds; above that, you’re in yellow or red territory.
Cumulative Layout Shift (CLS) measures how much content shifts while a page is loading. For example, if you tap a button only to have it move out of the way, CLS tracks that, and a high score may cause confusion and frustration for your users.
Total Blocking Time (TBT) is how long a web page’s main thread was blocked or busy with tasks that might prevent or delay a user’s interaction.
LCP, CLS, and the newest Interaction to Next Paint (INP) together make up Google’s Core Web Vitals.
Testing Your Speed Performance Using Google PageSpeed Insights
The first place to begin testing out your website is Google PageSpeed Insights. It will present you with a performance score for any URL you enter and rate it from 0 to 100 for both mobile and desktop devices—plus a list of actionable performance issues.
90 or more is considered good, whereas 50-89 indicates that there is a lot of room for improvement. A score of less than 50 means that action needs to be taken to enhance the user experience.
PageSpeed Insights will provide you with a detailed report of the data collected by Chrome (Field data) and simulated data (Lab data) from a simulation. They are both important, but the bottom line is real-world field data is the truth and what visitors are actually experiencing. To take a good laboratory grade and discount the poor field grade would be a bad idea.
Where Page Speed Issues Originate
The speed score simply informs you that your website is performing poorly, while the diagnostic breakdown provides a rationale for why this is the case. The latter is a helpful tool to determine your next steps.
Unoptimized images. This is by far the most frequent offender, and it’s not uncommon for them to remain undiscovered despite their size. The mere existence of one hero image saved at a print resolution can consume multiple megabytes of data storage. One such image can turn a page that should take 1.5 seconds to load into one that takes upwards of five or more. To resolve this, compress your images, convert them to WebP format, and ensure you’re setting a height and width attribute for the image so the browser has some idea of how much space to reserve for it. This will help your Core Web Vital “Cumulative Layout Shift” score by ensuring the images don’t cause the site layout to jump around after load.
Render-blocking JavaScript and CSS. This refers to files that prevent the browser from displaying the page until they have been parsed entirely. In these cases, non-critical scripts can be deferred, CSS files can be minified, and you can load only the content that is actually required for that page to function.
No browser caching enabled. The result is that every visitor to your site has to download all of your site’s static assets anew. By enabling caching, you ensure that returning visitors can load files from their cache on subsequent visits, which can significantly improve the speed of the site for such visitors.
No compression enabled. Enabling Gzip and/or Brotli compression on your HTML, CSS, and JavaScript files can easily reduce the size of said files by as much as 60 to 80%.
Slow server response time / High TTFB. In many cases, you may have a hosting infrastructure issue, as the geographic location of your site, quality of host, and the time to render content from your database all affect the speed at which the server responds. No amount of image compression fixes a server that takes 2 seconds just to respond. Often the fix is as simple as switching hosting providers or utilizing managed WordPress hosting solutions.
How a CDN Helps
CDN stands for content delivery network. CDNs distribute your site content across servers in multiple countries around the world. In effect, a visitor to your site doesn’t have to reach out to where you are based to download assets, but rather to a much closer server.
If someone in Seattle accesses your site, which is hosted in Miami, they don’t need to wait for data to traverse the US and then come back to them. The data comes from a CDN in Seattle instead. This significantly decreases the latency, improving TTFB, and reduces the amount of load required from your host during periods of high volume. This is standard practice for any site with a significant national or international audience, and services like Cloudflare offer a truly useful free tier that provides significant value. Even small websites that haven’t thought about this would benefit greatly from using one.
Mobile Speed is the Primary Issue for Site Speed
Many website owners are not aware that Google indexes your mobile site over the desktop version. This default indexing was changed with Mobile-first Indexing’s final rollout in 2021. Mobile Speed Scores shouldn’t be ignored simply because you think desktop is more important.
Mobile testing is a better reflection of what people experience on a mobile device, and the differences are significant: processors are smaller, the connection isn’t always as good, and patience for a page to load is much lower. On a fiber line and desktop, a page might load in two seconds but take six seconds on a mid-range Android phone on LTE. That is not the same page experience.
Specifically, test using the mobile tab in PageSpeed Insights, and if your mobile score is a lot worse than desktop, treat this as the more urgent problem. For Google, it is.
The Optimizations That Move the Needle
Run through this list of best practices to improve page speed in a deliberate way rather than haphazardly:
- Compress and lazy-load images below the fold
- Minimize and defer JavaScript; use async loading to avoid render-blocking
- Set proper cache-control headers for returning visitors
- Enable Gzip or Brotli compression on your server for all text-based assets
- Use a CDN to host your static content
- Lower HTTP requests via file consolidation and removing unnecessary plugins and scripts
- Improve TTFB through better hosting or caching plugins like WP Rocket or LiteSpeed Cache
- Preload your most critical resources, especially fonts and images that appear above the fold
For WordPress sites, the usual suspects behind a slow site are a bloated theme, too many plugins, and a database that has never been optimized for speed. It’s realistic to push a score from the 40s to the 80s just by swapping to a lightweight theme and a good caching plugin and cleaning out your database; zero code changes necessary.
How Page Speed Relates to the Rest of Your Technical SEO
Page speed is part of technical SEO: the umbrella term that refers to anything related to the infrastructure that allows search engines to crawl, index, and rank your website properly. Speed issues won’t stay isolated; a reduced crawl budget means your new content could take days or weeks longer to get noticed by Google. You’re absorbing a huge delay in your rankings when you could easily take action to correct the problem.
Fixing your page load speed will make your general SEO efforts better, too. You are more likely to rank better and more quickly with good content on a technically optimized site. Your links will be of more value, your UX will improve, and the ranking factors that matter most to Google will start taking effect. Businesses that don’t address page load speed in their online marketing campaign will see their page ranking positions slowly erode while other, more aggressive competitors keep working on their optimization and Google constantly changes the algorithm rules. The process is never really done; you just need to set up a system to monitor the status of your technical performance.
 Continue Testing Your Speed Once You’ve Optimized
Load time scores drift. You add a new plugin, upload a high-resolution uncompressed image, or switch page builders, and you could undo months of optimization work in minutes without even knowing it. More often than not, you won’t know a thing until your rankings start dropping and you can’t find the cause.
Check your load speed score on a regular schedule; at least monthly, or perhaps quarterly if your pages are updated less frequently. Google Search Console will show you the Core Web Vitals of all your pages for your entire site, so be sure to check the status at regular intervals to catch these problems before they become actual issues.
GOA-TECH offers website optimization services for companies looking to keep their technical performance a part of their ongoing SEO strategy. If your site is running slow and you’re not sure where to start, the team offers a free consultation to dig into what’s actually holding your load times back.